Natural Gas Production Report, 2016 Quarter 2
August 26, 2016 | Energy
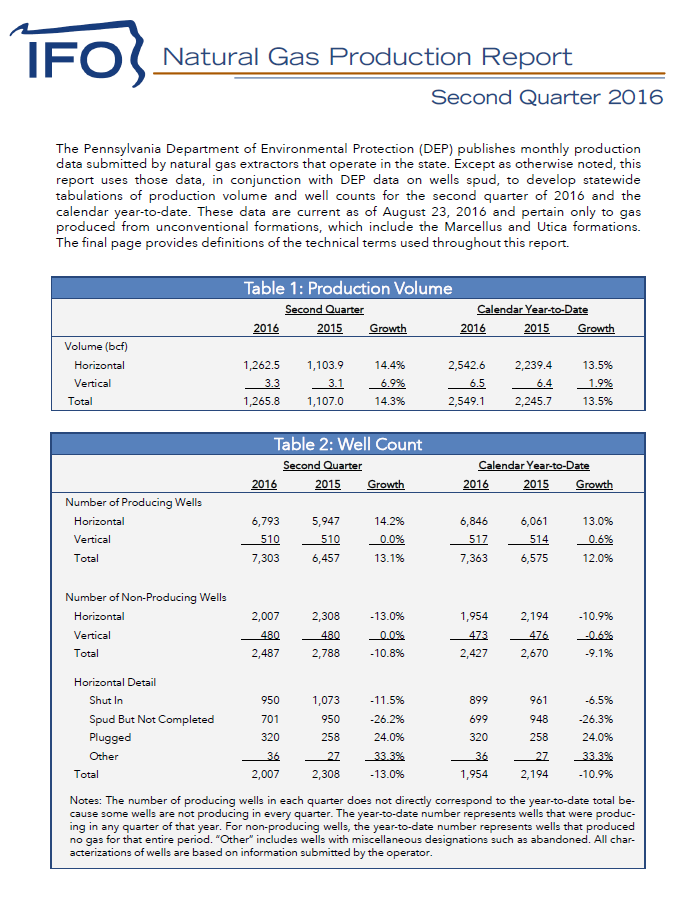
The Pennsylvania Department of Environmental Protection (DEP) publishes monthly production data submitted by natural gas extractors that operate in the state. Except as otherwise noted, this report uses those data, in conjunction with DEP data on wells spud, to develop statewide tabulations of production volume and well counts for the second quarter of 2016 and the calendar year-to-date. These data are current as of August 23, 2016 and pertain only to gas produced from unconventional formations, which include the Marcellus and Utica formations. The final page provides definitions of the technical terms used throughout this report.
During the first half of 2016, year-over-year production volume from horizontal wells increased 13.5 percent, driven mainly by wells spud in 2014 and 2015. The increase in production from such wells (110.1 percent) corresponds to the increase in the number of producing wells (112.3 percent). Conversely, wells spud in 2012 and 2013 showed declines in production despite small increases in the number of producing wells, and the decline in production from wells spud in 2011 or earlier outpaced the decline in the number of producing wells. These trends are consistent with the general decline in productivity of wells as they age.
Susquehanna County was the highest-producing county in the state, representing nearly one quarter of all horizontal well production (24.0 percent). The largest increases in production among top-ten counties occurred in the southwest region of the state (Greene, Washington, Fayette and Butler). All declines in production occurred in the northeast region of the state (Bradford, Lycoming, Tioga and Sullivan).
Between 2011 and 2015, annual production grew at an average rate of 44.6 percent per annum. Since the first quarter of 2015, the number of producing wells has grown every quarter. However, the number of new wells spud declined during that same time. The term “spud” denotes the beginning of the drilling process, and there is often a substantial lag before a well produces output.
Shut-in wells and spud but not completed wells peaked in the third and first quarters of 2015, respectively, and began to decline after those periods. The full-year count of shut-in wells remains slightly higher in 2016 than the prior year, while the full-year count of spud but not completed wells has declined by 18.0 percent from the prior year.