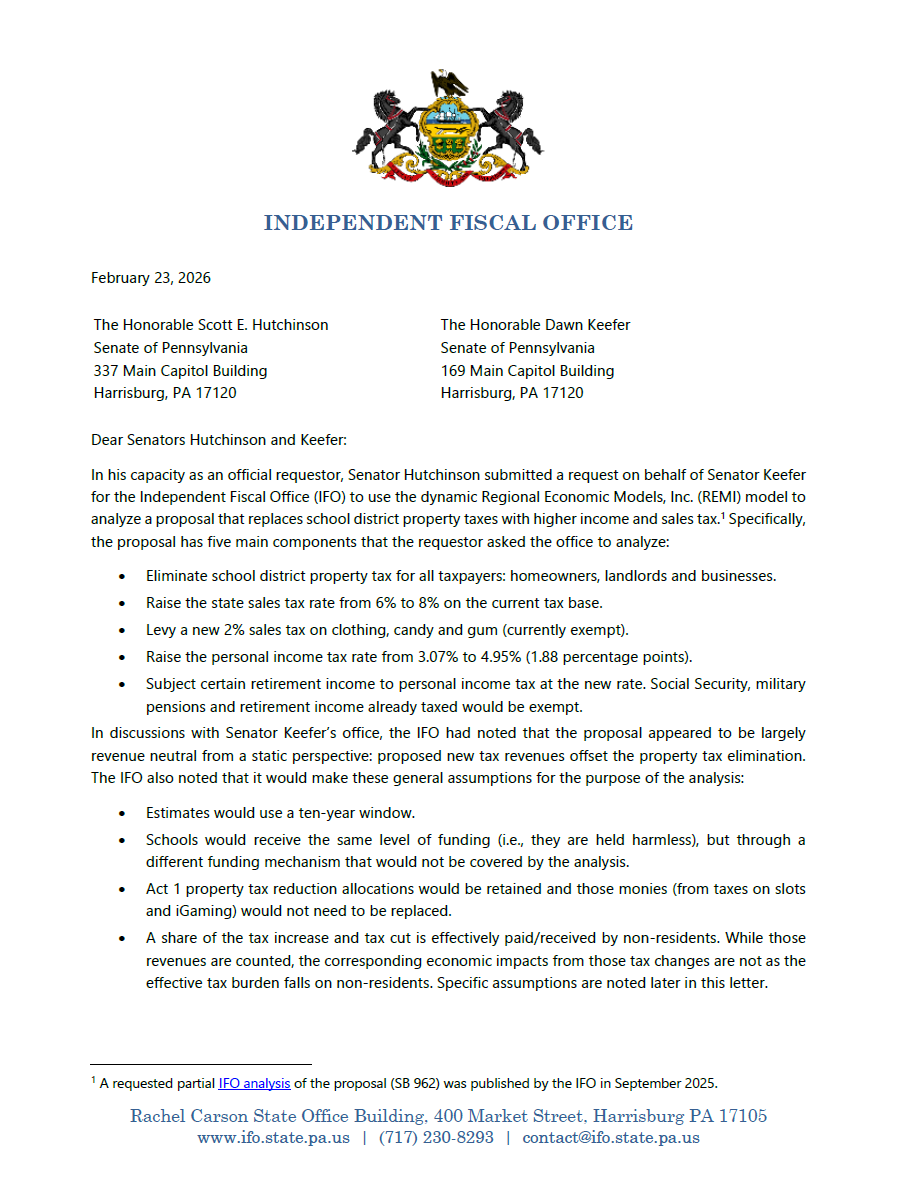
In response to a legislative request, the IFO used the dynamic REMI model to analyze a proposal that replaces school district property taxes with higher income and sales tax.
Director Knittel provided a budget and economic update to the PA Chamber of Business and Industry.
This report uses data from the U.S. Census Bureau, the Internal Revenue Service (IRS), the U.S. Bureau of Economic Analysis (BEA) and other sources to facilitate a comparison of state and local tax systems across the 50 states. The report examines (1) state and local effective tax rates across states, (2) the distribution of state and local taxes across revenue sources (e.g., income, sales and property) and (3) state debt levels.
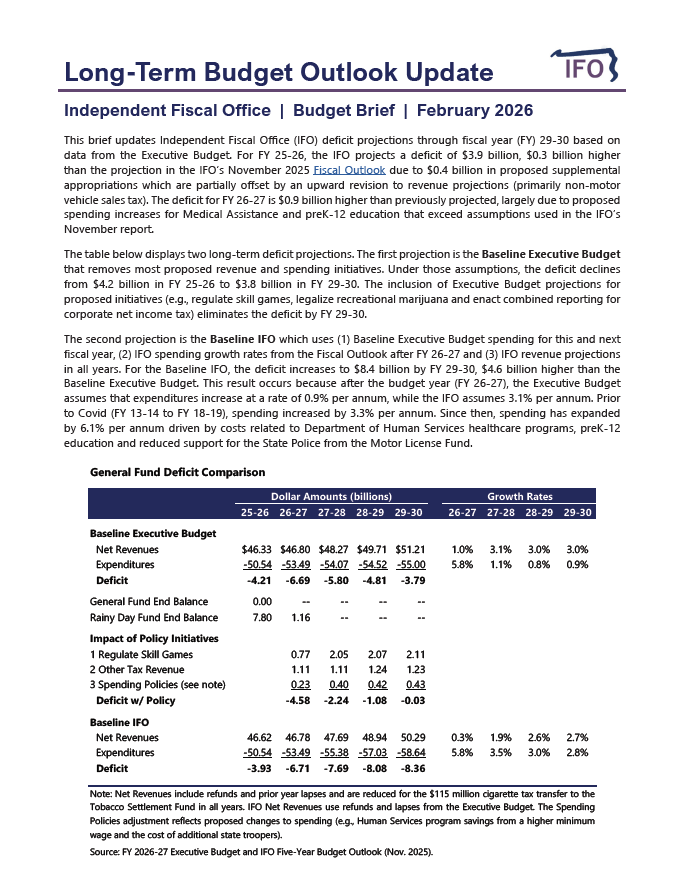
This budget brief provides updated IFO deficit projections through FY 2029-30. Excluding new revenues proposed in the Executive Budget, the FY 2025-26 underlying structural deficit of $3.9 billion is projected to expand to $8.4 billion by FY 2029-30.
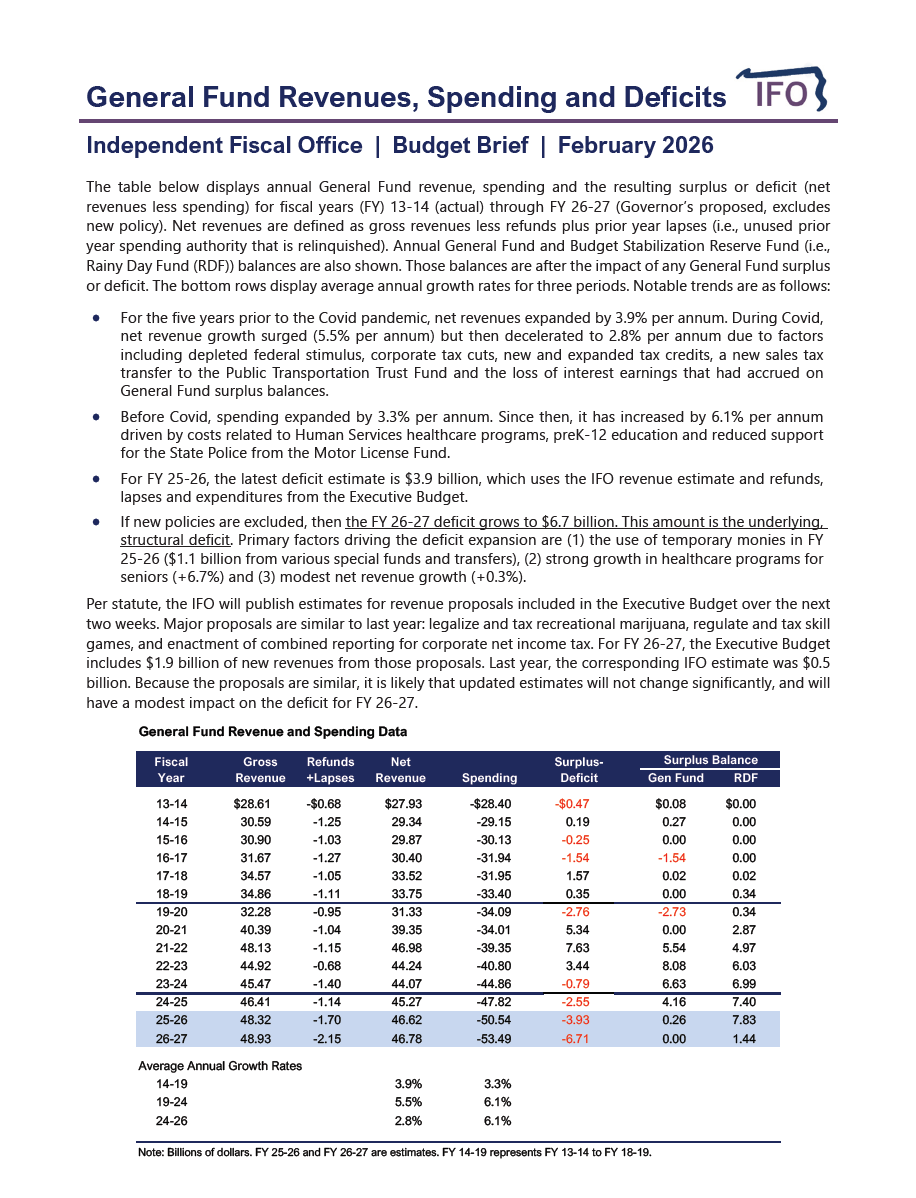
This budget brief tracks General Fund surpluses and deficits since FY 2013-14. Excluding new revenue and spending policies proposed in the Executive Budget, the underlying structural deficit is projected to expand to $6.7 billion in FY 2026-27.
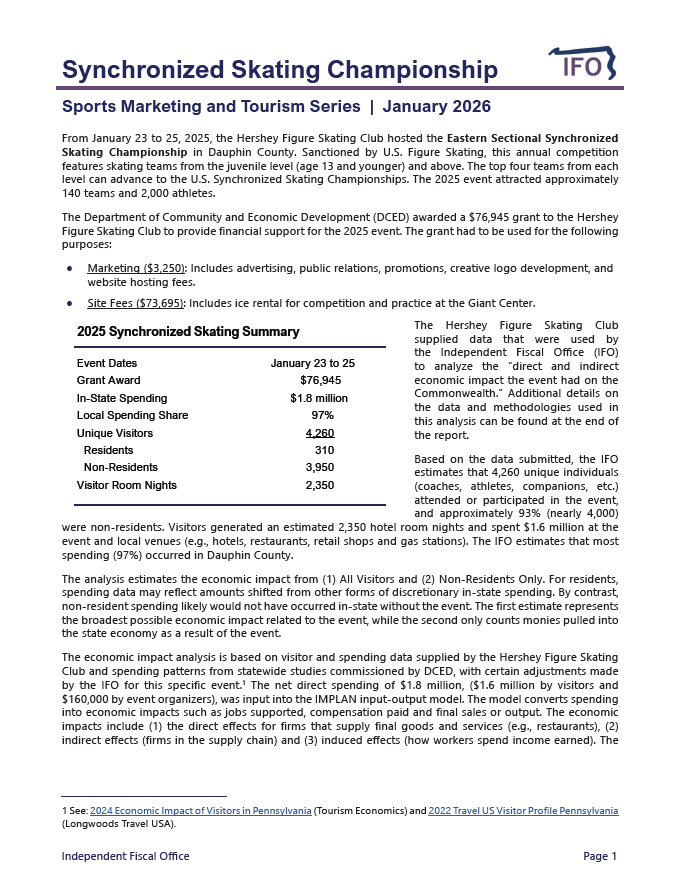
As required by statute, the IFO submitted an economic impact report for the Eastern Sectional Synchronized Skating Championship in Dauphin County (January 2025) to the General Assembly. The analysis finds that economic activity related to the event generated $2.6 million in statewide spending and $102,000 in select state and local taxes.
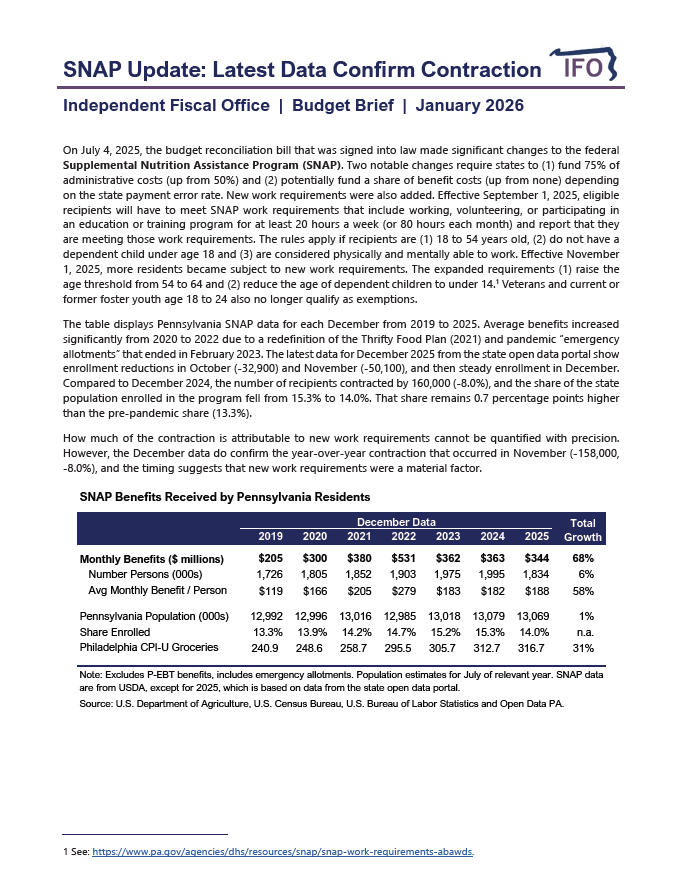
The IFO published a budget brief that uses the latest SNAP benefits data for December 2025. For the second consecutive month, the data show that the number of enrollees declined by 160,000 (-8%) from the prior year as new work requirements took effect.
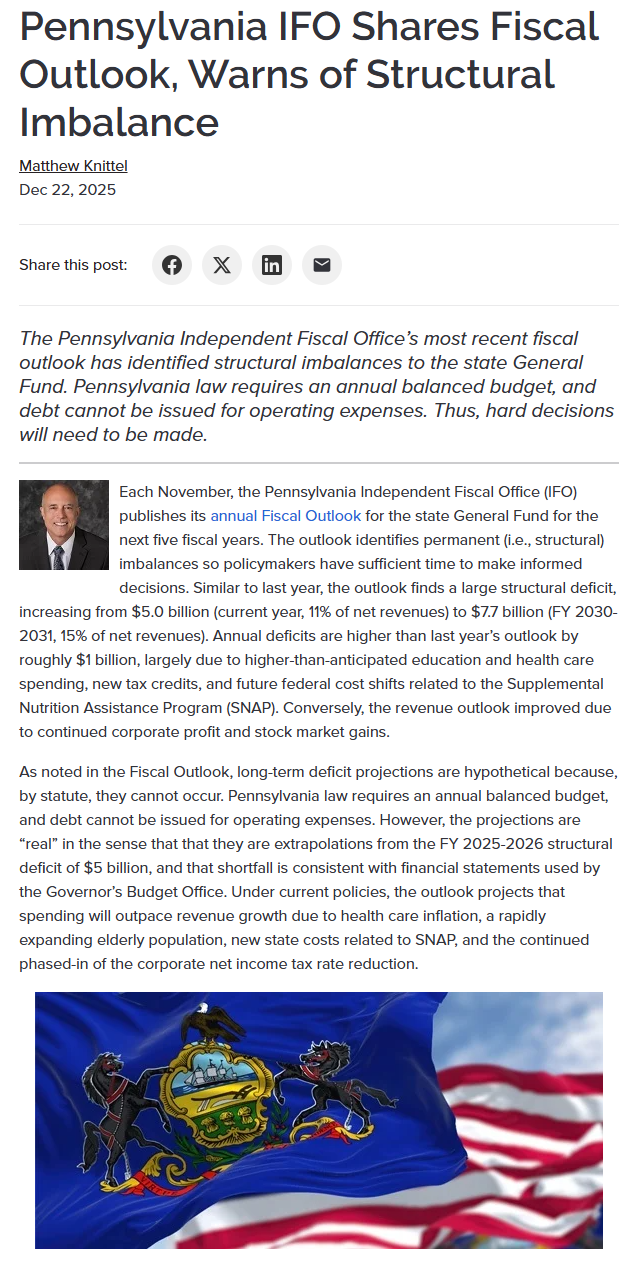
Director Knittel submitted content for publication in the CPA Now blog posted on December 22, 2025. The blog discusses the $5 billion structural deficit for FY 25-26 and provides background on income and sales tax that might be used to address it.
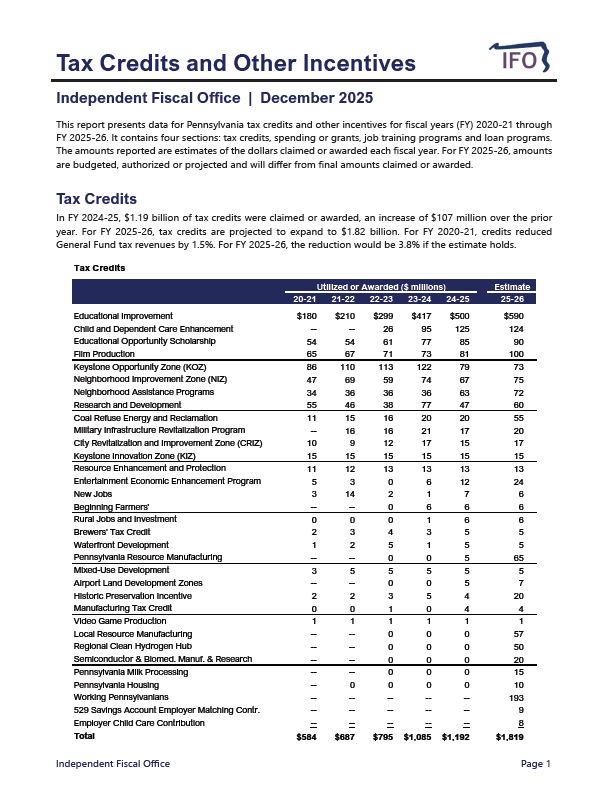
This report presents data on Pennsylvania tax credits and economic development incentives for fiscal years (FY) 2020-21 through FY 2025-26. The tables provide annual detail on tax credit utilization or awards, state spending or grants, job training programs and state loan programs. Fiscal year 2025-26 amounts are budgeted, authorized or projected and will differ from final amounts claimed or awarded. The report also highlights recent changes to incentive program spending or utilization.
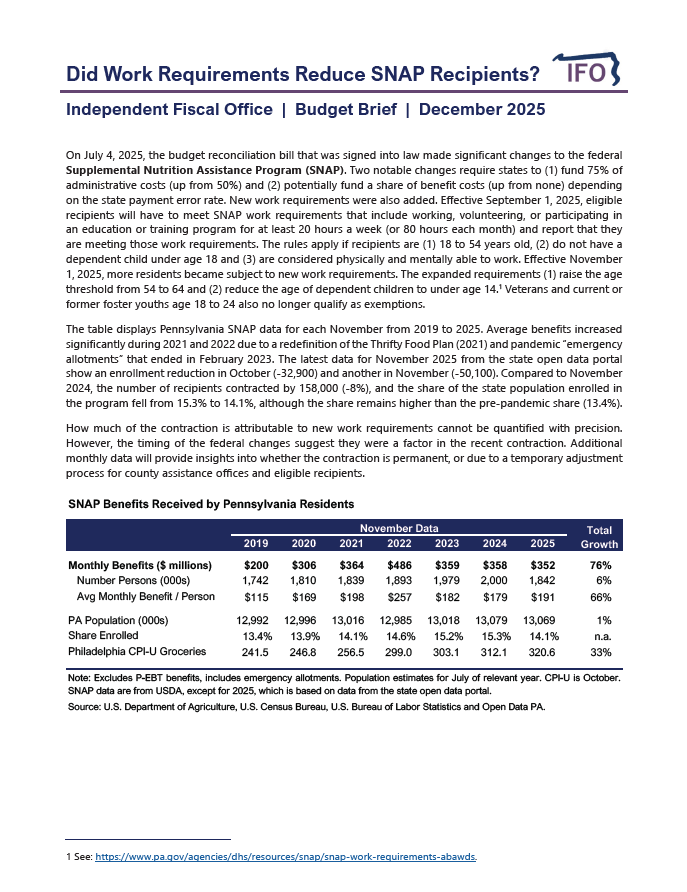
The IFO published a new budget brief that uses the latest SNAP benefits data for November 2025. The data show that the number of enrollees declined by 158,000 (-8%) from the prior year as new work requirements take effect.