This research brief examines IRS tax data to track migration between states for 2022 to 2023. The IRS data indicate net domestic migration for Pennsylvania was -14,880 (-0.11% of state population), which ranked 38th across all states. Large net inflows came from border states and net outflows went to southern states, most notably Florida. The adjusted gross income per tax return filed averaged $77,300 for the inflow group and $86,900 for outflows, with a total net outflow of -$2.29 billion.
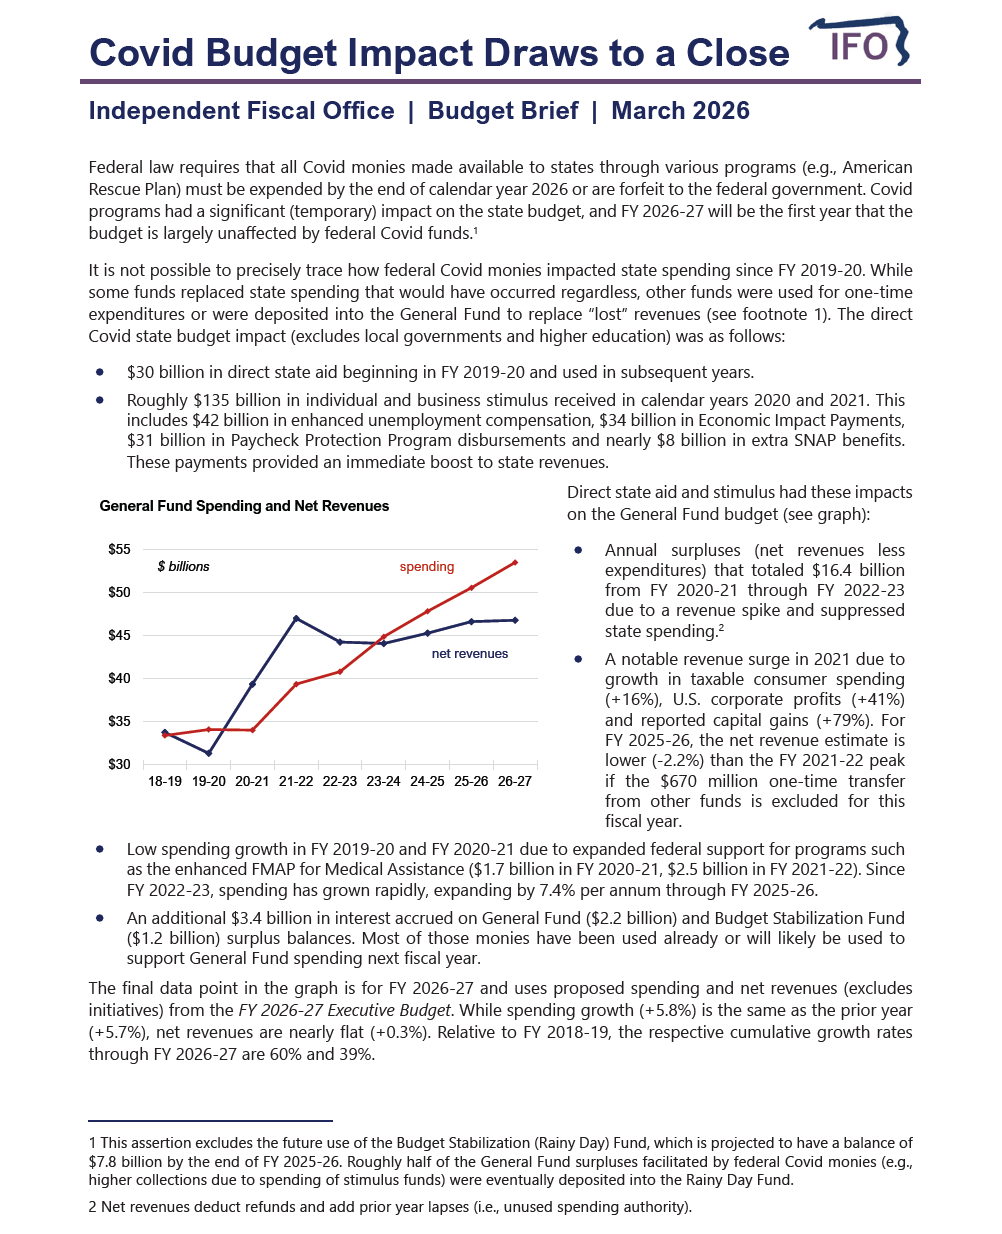
This brief considers the budget impact from direct federal Covid relief funds to the state and federal stimulus monies to residents and businesses.
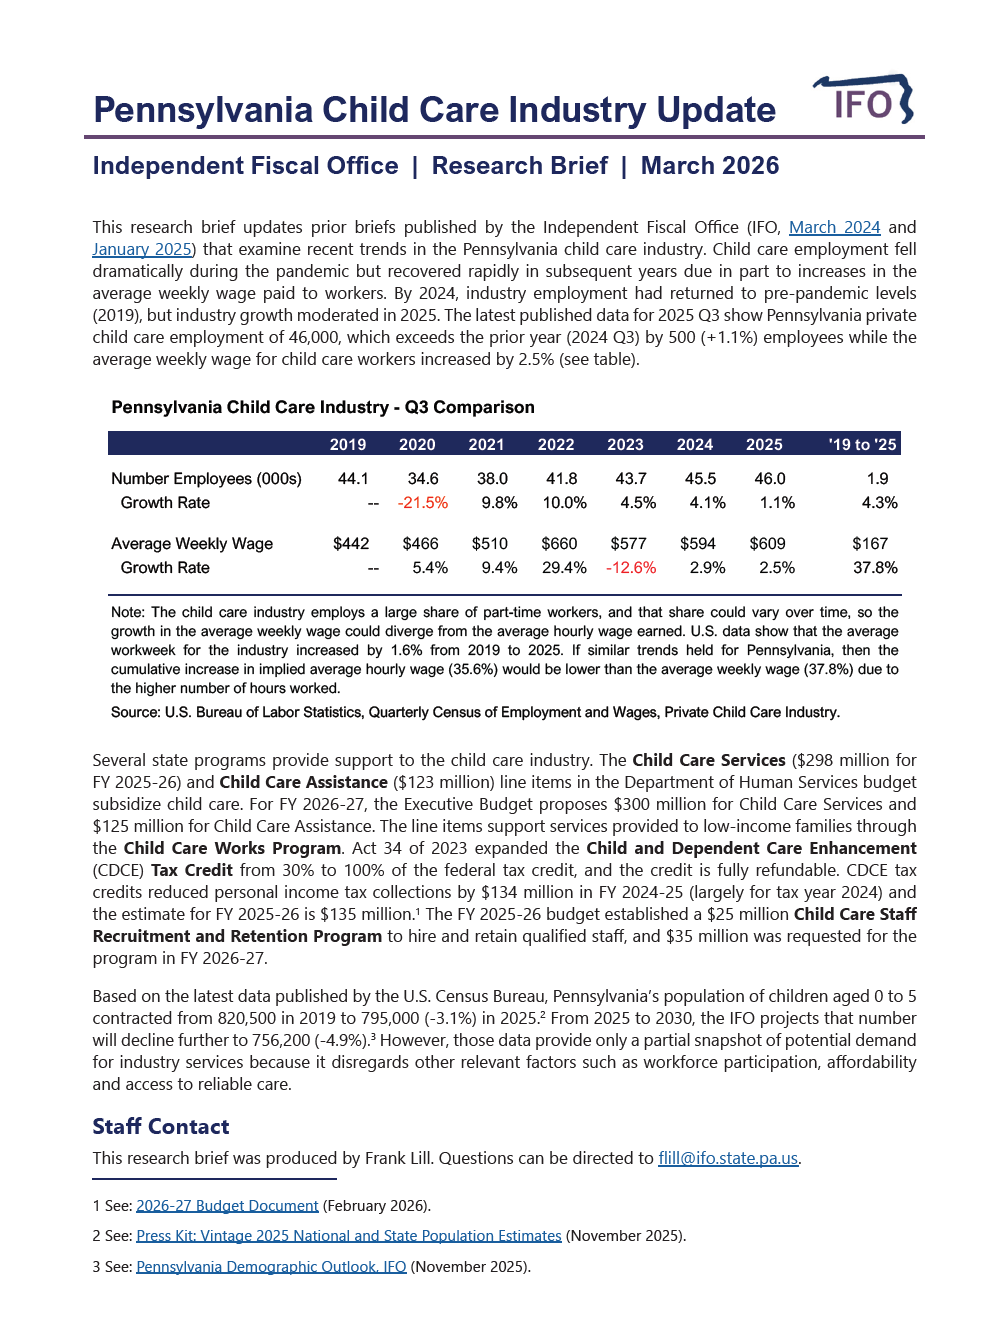
This research brief provides an update of child care industry employment and wages. For 2025 Q3, Pennsylvania private child care employment exceeds prior year levels (2024 Q3) by 500 employees, while average industry wages increased by 2.5%. The brief also highlights several state programs that provide support to the child care industry.
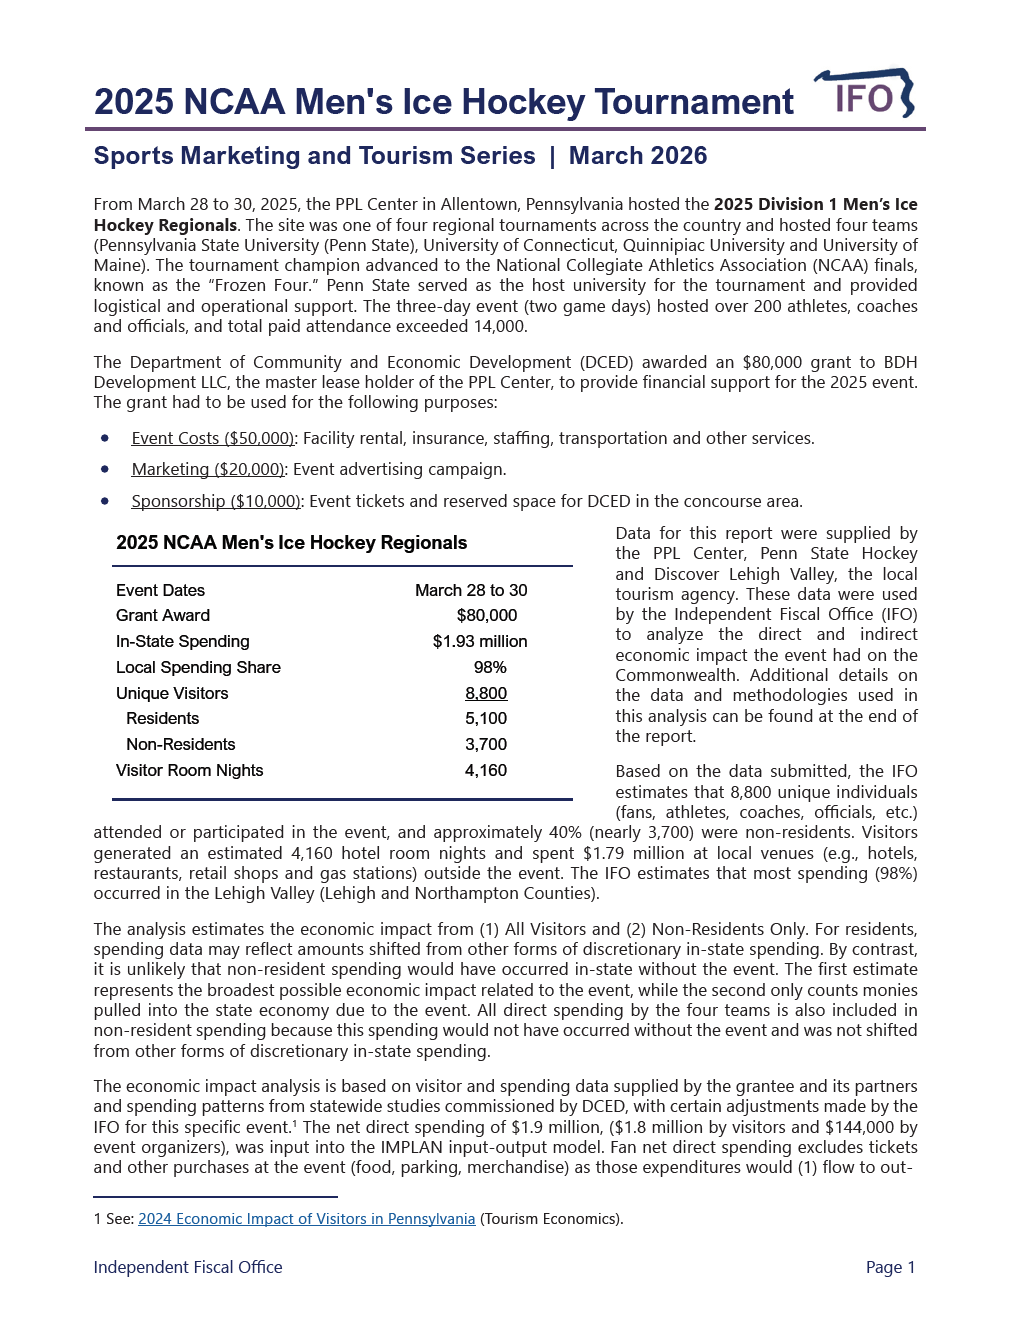
As required by statute, the IFO submitted an economic impact report for the NCAA Men’s Ice Hockey Tournament in Allentown (March 2025) to the General Assembly. The analysis finds that economic activity related to the event generated $2.5 million in statewide spending and $161,000 in select state and local taxes.
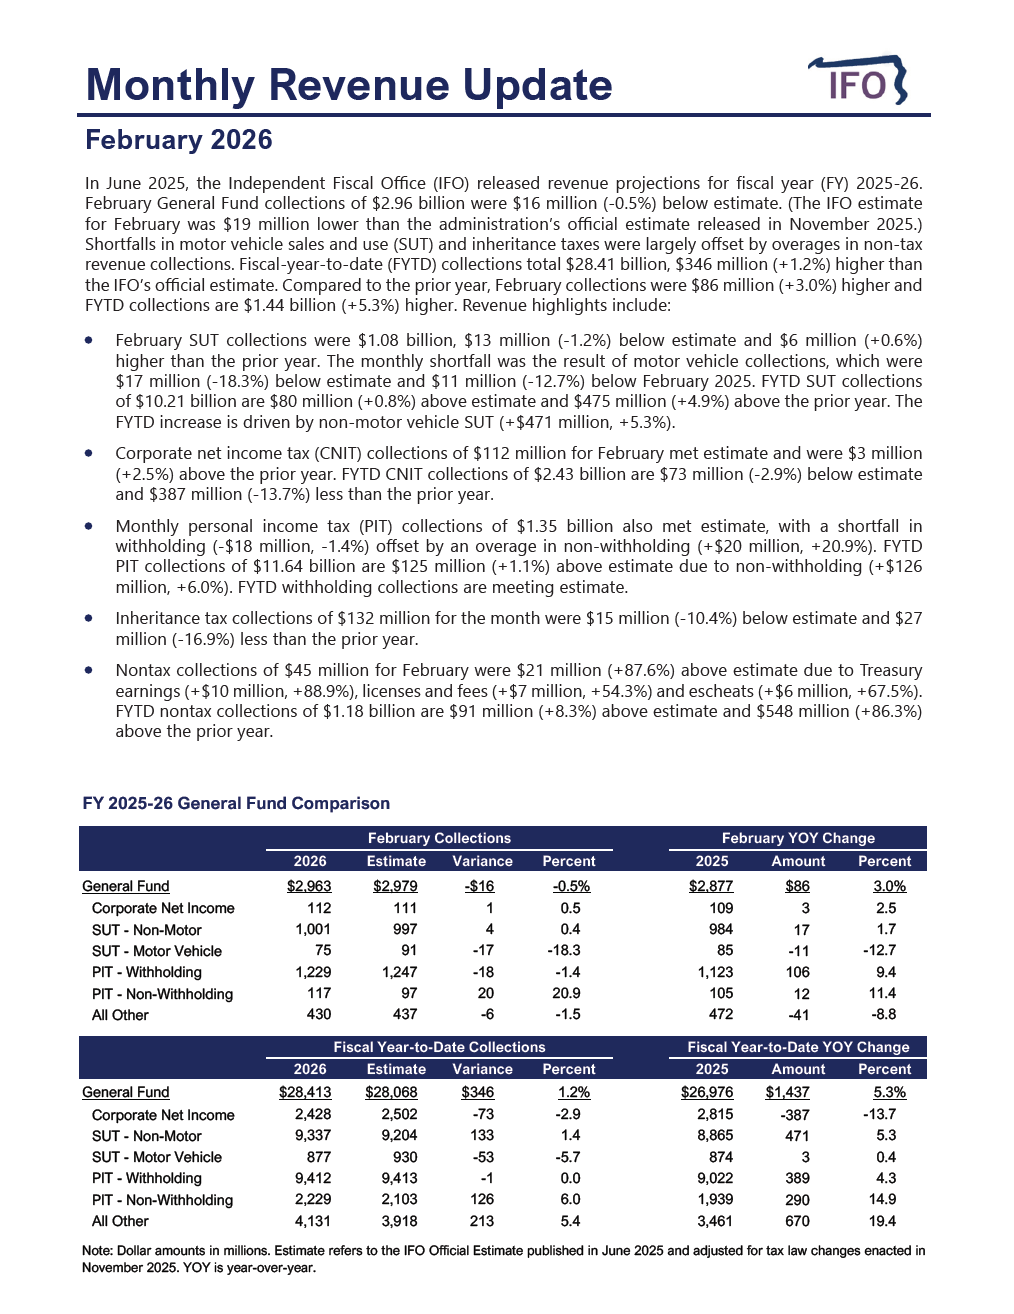
The Commonwealth collected $2.96 billion in General Fund revenues for February, an increase of $86 million compared to February 2025.
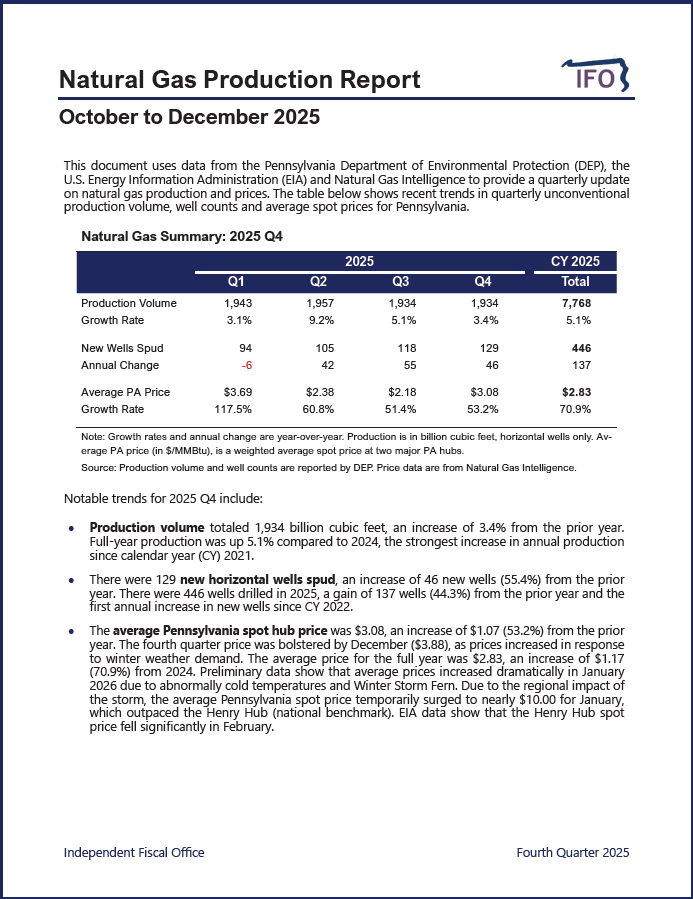
This document uses data from the Pennsylvania Department of Environmental Protection, the U.S. Energy Information Administration and Natural Gas Intelligence to provide a quarterly update on recent trends in production volume, well counts and average spot prices.
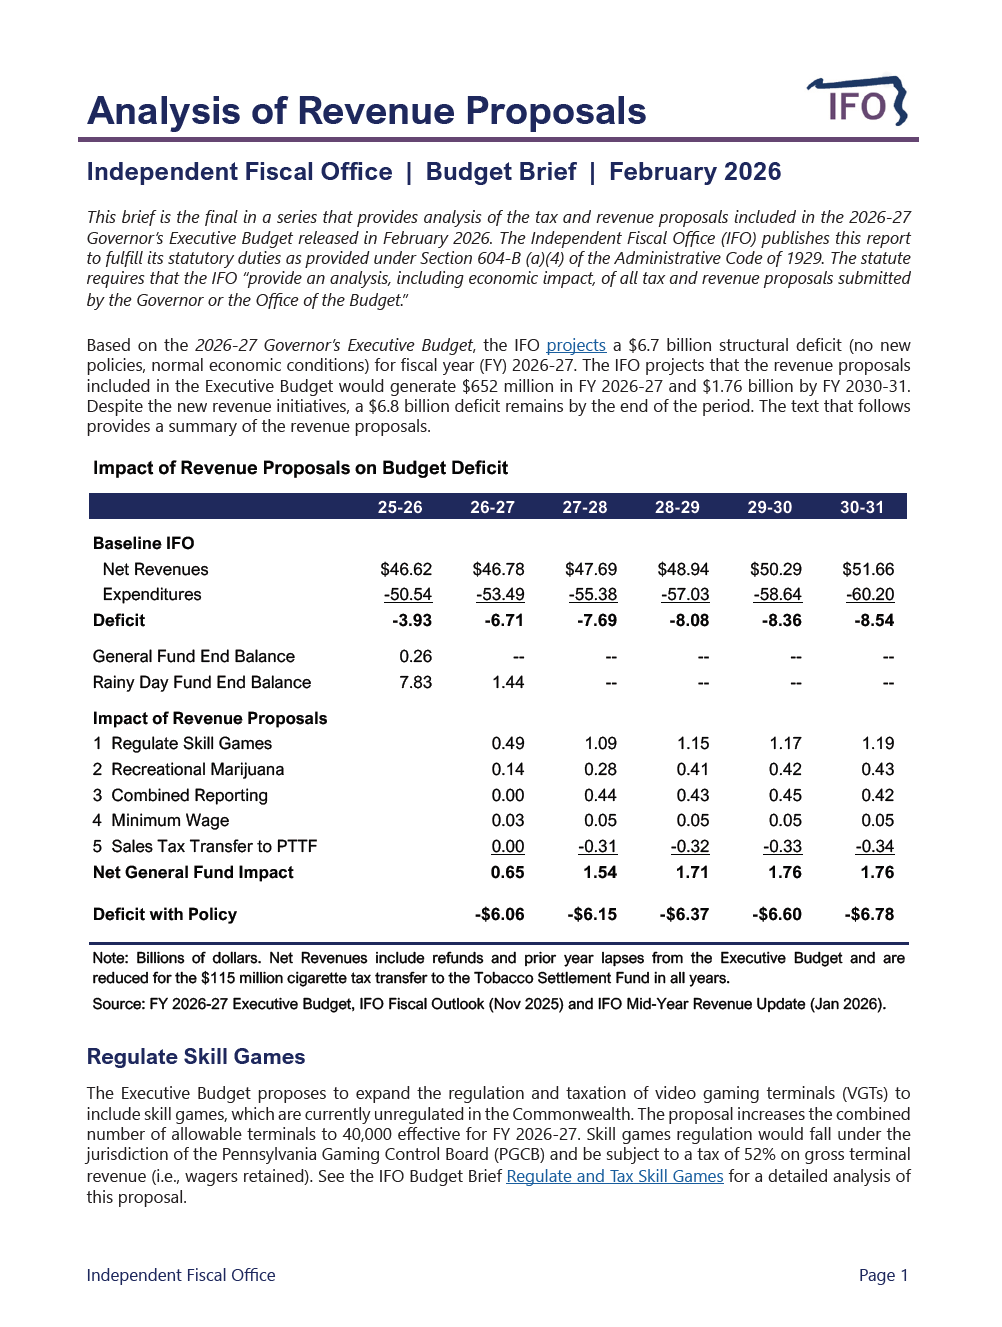
This budget brief is the final in a series that provides analysis of the revenue proposals included in the 2026-27 Governor’s Executive Budget. The IFO projects that the proposals would generate $652 million in FY 2026-27 and $1.76 billion by FY 2030-31. Despite the new revenue initiatives, a $6.8 billion deficit remains by the end of the period.
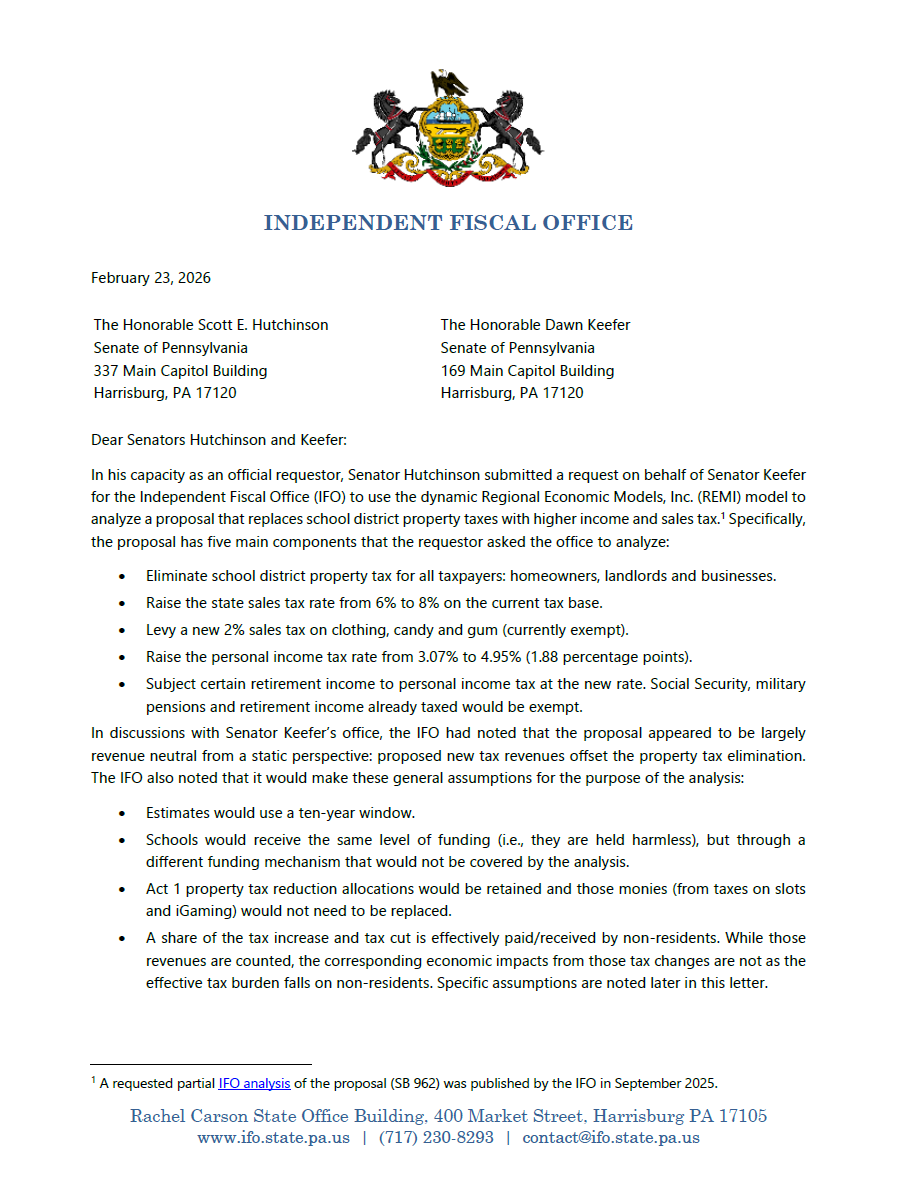
In response to a legislative request, the IFO used the dynamic REMI model to analyze a proposal that replaces school district property taxes with higher income and sales tax.
Director Knittel provided a budget and economic update to the PA Chamber of Business and Industry.
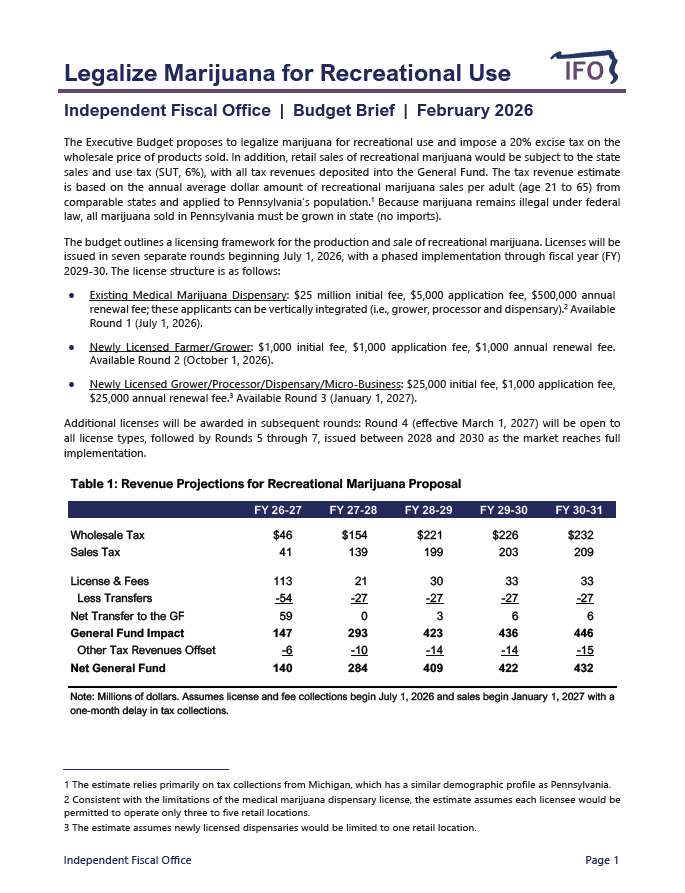
This report provides a revenue estimate for the proposal to legalize recreational marijuana contained in the FY 2026-27 Governor's Executive Budget. The Independent Fiscal Office (IFO) publishes this report to fulfill its statutory duties as provided under Section 604-B (a)(4) of the Administrative Code of 1929. The act requires that the IFO “provide an analysis, including economic impact, of all tax and revenue proposals submitted by the Governor or the Office of the Budget."