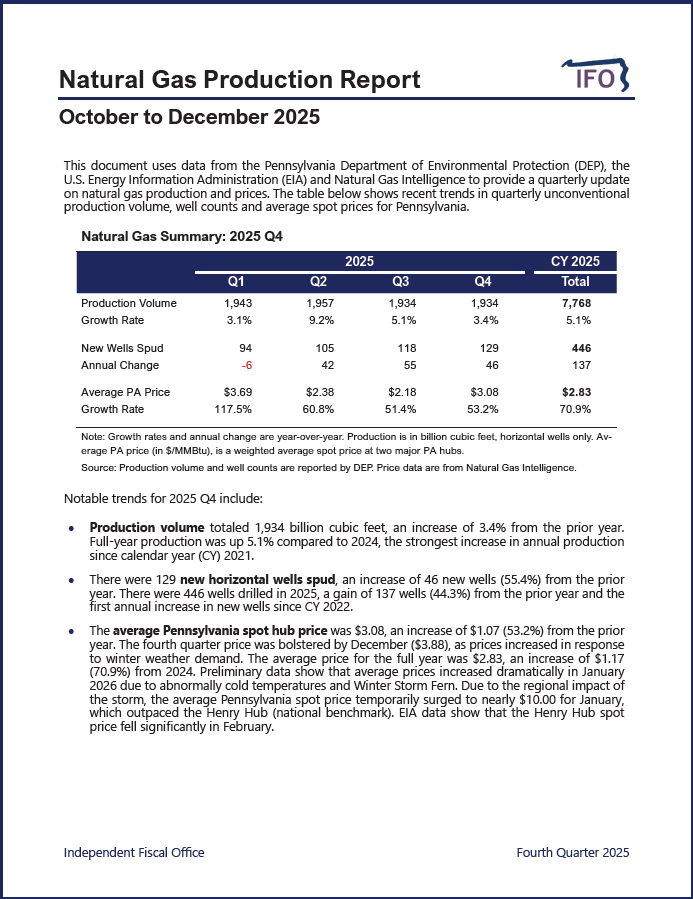
This document uses data from the Pennsylvania Department of Environmental Protection, the U.S. Energy Information Administration and Natural Gas Intelligence to provide a quarterly update on recent trends in production volume, well counts and average spot prices.
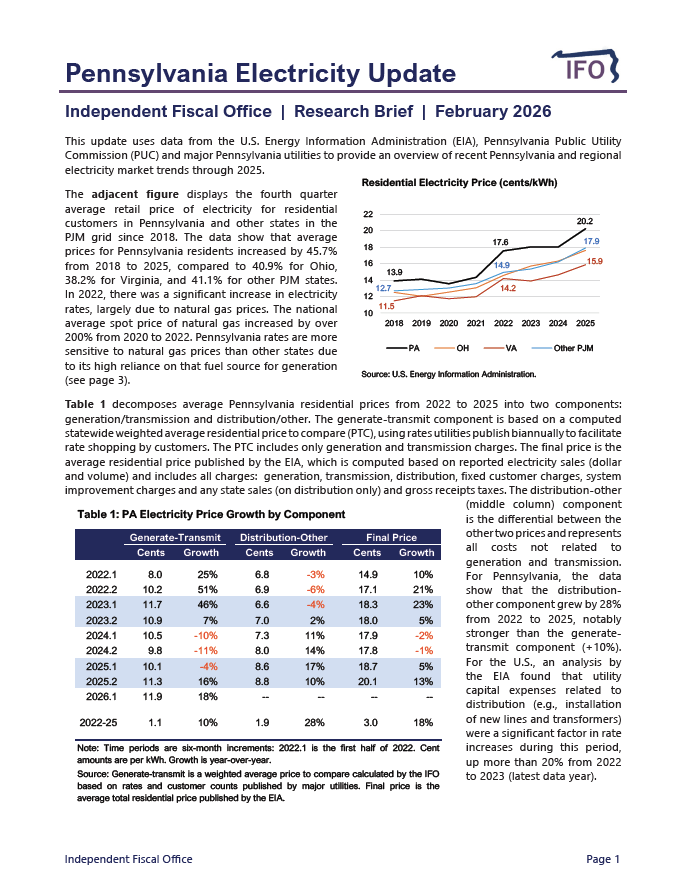
This report utilizes data from the U.S. Energy Information Administration to display recent trends for the Pennsylvania and regional electricity markets. The report examines recent trends in prices, net generation and net exports.
This research brief was updated on March 11, 2026 to reflect new 2025 data for (1) electricity generation, consumption, and residential prices reported by the EIA and (2) the Alternative Energy Portfolio Standards Act.
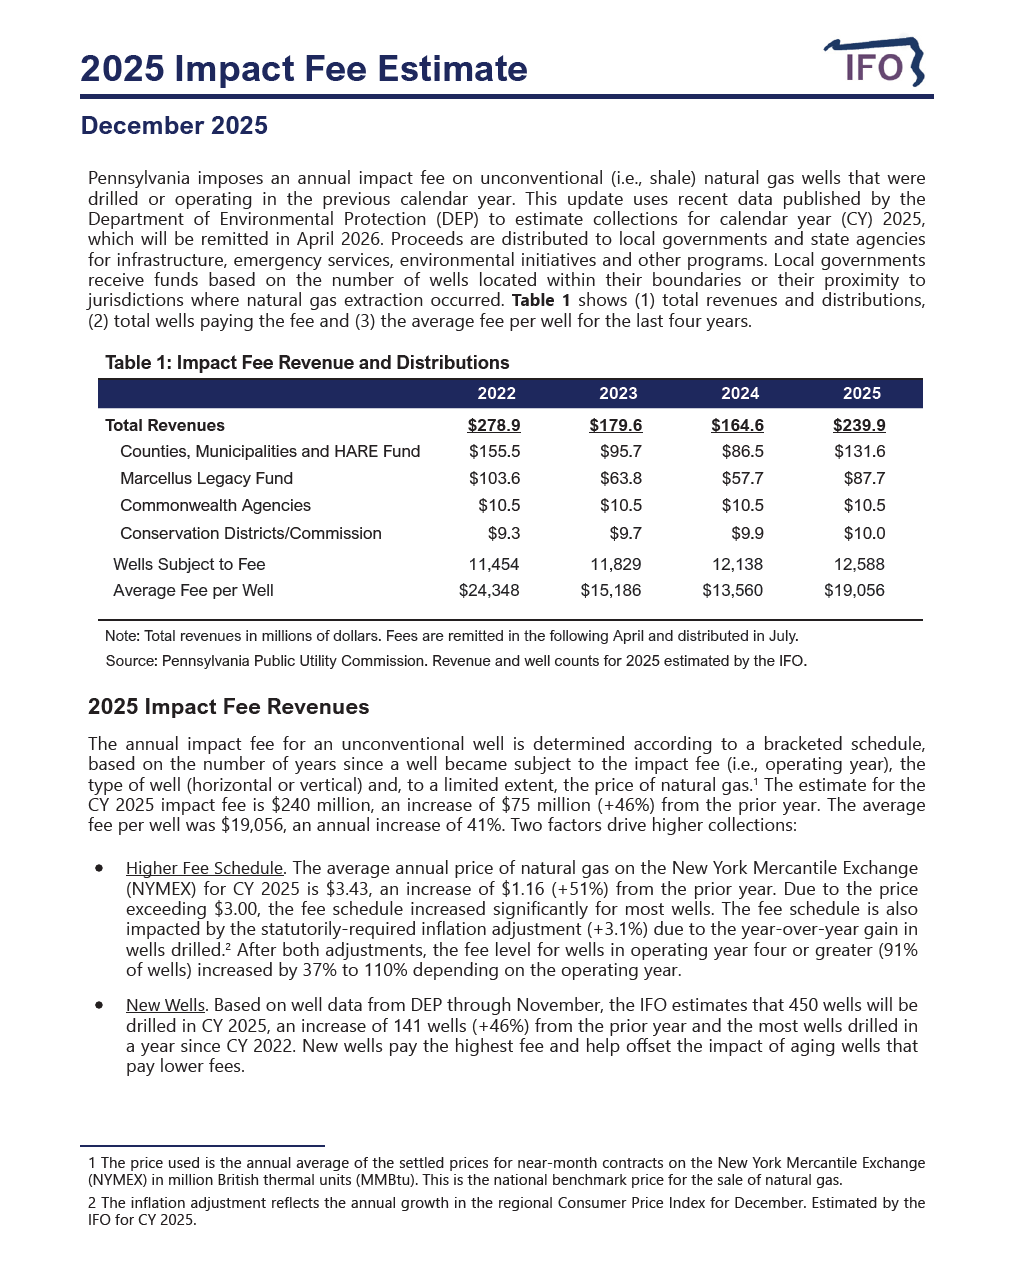
This report uses recent data published by the Department of Environmental Protection to project CY 2025 Impact Fee collections (remitted April 2026). Collections are estimated to be $240 million, an increase of $75 million from the prior year.
This document uses data from the Pennsylvania Department of Environmental Protection, the U.S. Energy Information Administration and Natural Gas Intelligence to provide a quarterly update on recent trends in production volume, well counts and average spot prices.
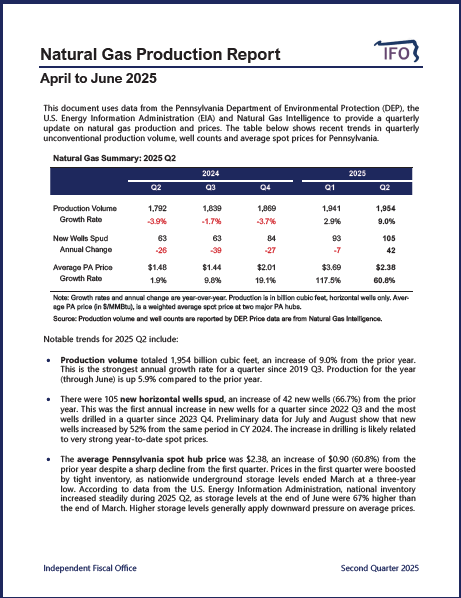
This document uses data from the Pennsylvania Department of Environmental Protection, the U.S. Energy Information Administration and Natural Gas Intelligence to provide a quarterly update on recent trends in production volume, well counts and average spot prices.
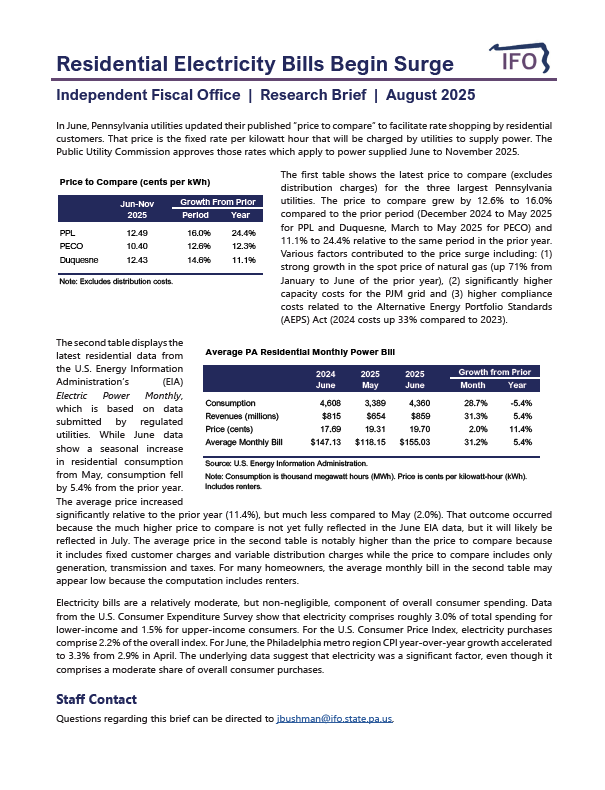
This research brief discusses recent increases in electricity prices for Pennsylvania residential consumers. The price to compare for residential customers at three large utilities increased by 13% to 16% for June through November compared to the prior six months. Relevant factors include (1) growth in natural gas prices, (2) higher capacity costs for the PJM grid and (3) compliance costs related to the Alternative Energy Portfolio Standards.

This update examines 2024 impact fee collections and provides an outlook for 2025. Collections totaled $164.6 million for 2024, a decrease of $15.0 million from 2023.

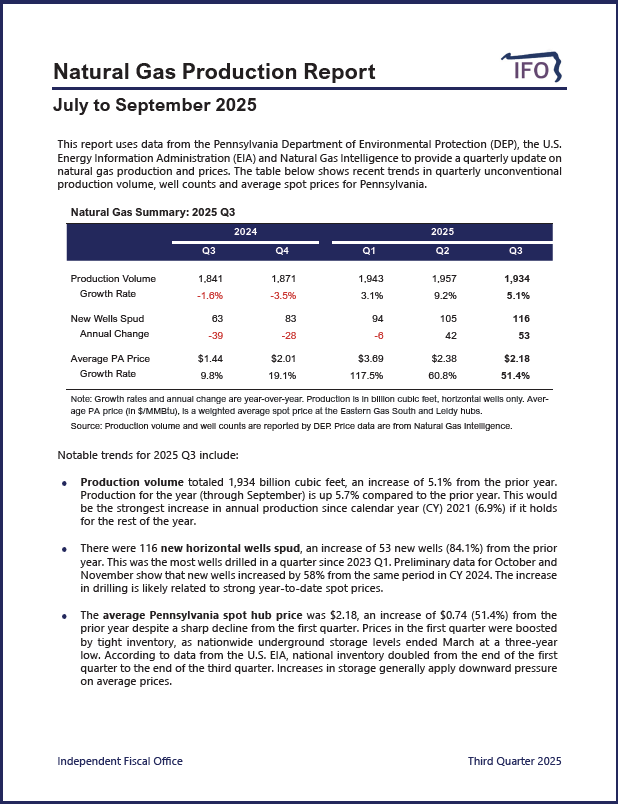
This document uses data from the Pennsylvania Department of Environmental Protection, the U.S. Energy Information Administration and Natural Gas Intelligence to provide a quarterly update on recent trends in production volume, well counts and average spot prices.

This document uses data from the Pennsylvania Department of Environmental Protection, the U.S. Energy Information Administration and Natural Gas Intelligence to provide a quarterly update on recent trends in production volume, well counts and average spot prices.

This report utilizes data from the U.S. Energy Information Administration to display recent trends for the Pennsylvania and regional electricity markets. The report examines recent trends in net generation, net exports, CO2 emissions and prices.