Natural Gas Production Report, 2015 July to December
February 29, 2016 | Energy

The Pennsylvania Department of Environmental Protection publishes monthly production data submitted by natural gas extractors that operate in the state. This report uses those data to develop statewide and county-level tabulations of production volume and well counts for the last six months of 2015 and the full calendar year. The data summarized in this report pertain exclusively to gas produced from unconventional formations, which include the Marcellus and Utica formations.
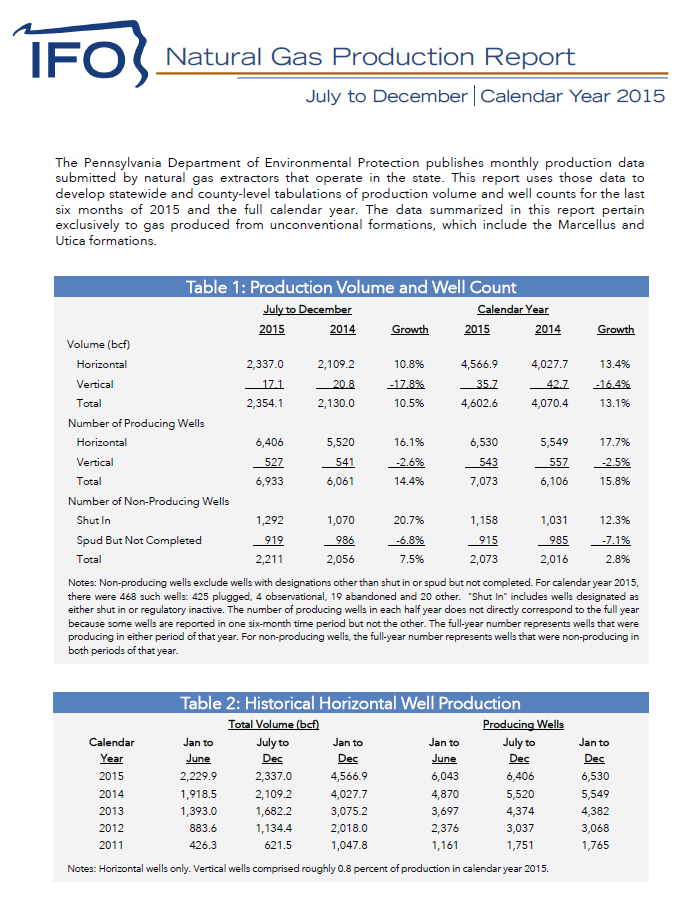
Horizontal unconventional gas wells produced 2,337.0 bcf of natural gas from July to December 2015, an increase of 227.8 bcf (10.8 percent) compared to the same period in 2014. For all of calendar year 2015, horizontal unconventional gas wells produced 4,566.9 bcf of natural gas, an increase of 539.2 bcf (13.4 percent) from 2014. Compared to the 52.4 percent increase in 2013 and the 31.0 percent increase in 2014, the most recent production data reflect a slowdown in the rate of growth.
More than one-half of horizontal well production during the second half of 2015 and the full calendar year was driven by wells spud in 2013 and 2014 (see Tables 3A and 3B). This result is due to the substantial lag between a well’s spud date, which represents the beginning of the drilling process, and the date a well produces output. In 2015, 784 horizontal wells were spud, of which 420 were spud in the first half of the year and 364 were spud in the second half. Of those wells, only 158 produced gas (20.2 percent). In comparison, of the wells spud in 2013 and 2014, 89.7 percent and 67.6 percent produced gas, respectively.
Susquehanna County was the top producing county in the state, representing nearly one-quarter of all horizontal well production. Each of the top ten producing counties registered increases in the number of producing wells for the calendar year, but four counties (Bradford, Lycoming, Tioga and Westmoreland) recorded a decline in production.