Natural Gas Production Report, 2015 January to June
September 15, 2015 | Energy

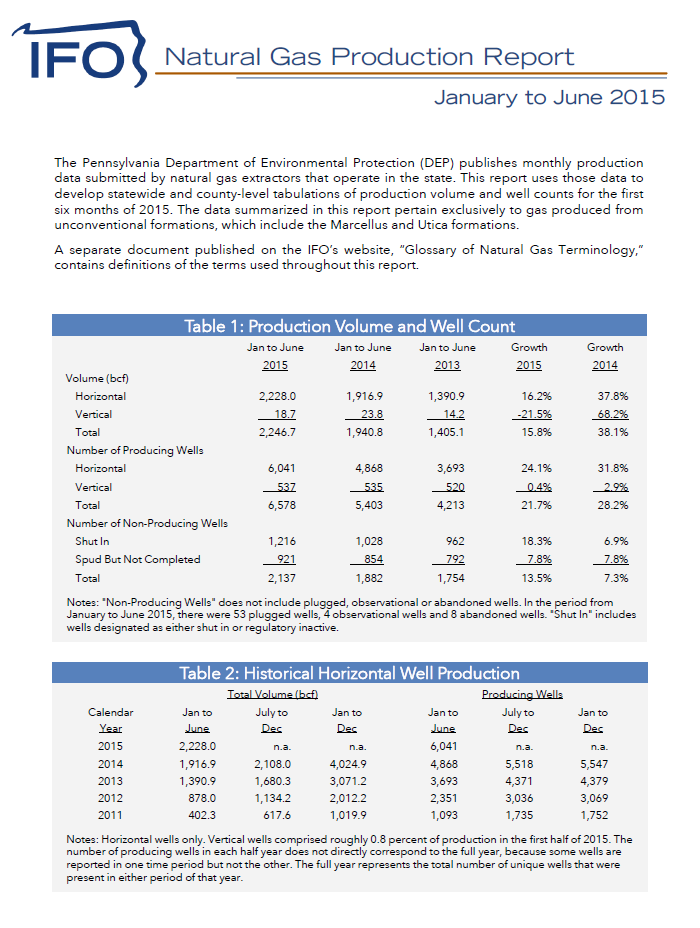
The Pennsylvania Department of Environmental Protection (DEP) publishes monthly production data submitted by natural gas extractors that operate in the state. This report uses those data to develop statewide and county-level tabulations of production volume and well counts for the first six months of 2015. The data summarized in this report pertain exclusively to gas produced from unconventional formations, which include the Marcellus and Utica formations.
A separate document published on the IFO’s website, “Glossary of Natural Gas Terminology,” contains definitions of the terms used throughout this report.
Production volume during the first half of 2015 was driven by wells spud in 2013 and 2014. For wells spud in 2014, 1,350 were spud, but only 652 (48.3 percent) produced gas between January and June 2015. These 652 wells comprised somewhat more than one-fifth (21.6 percent) of total production. For 2015, there were 420 wells spud through June, of which only 8 produced gas. The term “spud” denotes the beginning of the drilling process, and there is often a substantial lag before a well
produces output.
Susquehanna County remains the top producing county in the state. While Bradford County recorded lower output than the prior year, Washington and Greene Counties recorded significant gains. All of the top ten counties recorded a gain in the number of producing wells during the first half of the year.