July 2015
August 01, 2015 | Revenue & Economic Update
Labor force participation rates (LFPRs) are often viewed as a measure of the strength of the labor market. The Bureau of Labor Statistics (BLS) defines the LFPR as the labor force as a share of the civilian non-institutional population. The labor force includes those currently employed and those looking for work. The higher the LFPR, the larger share of the working-age population that is working or seeking employment.
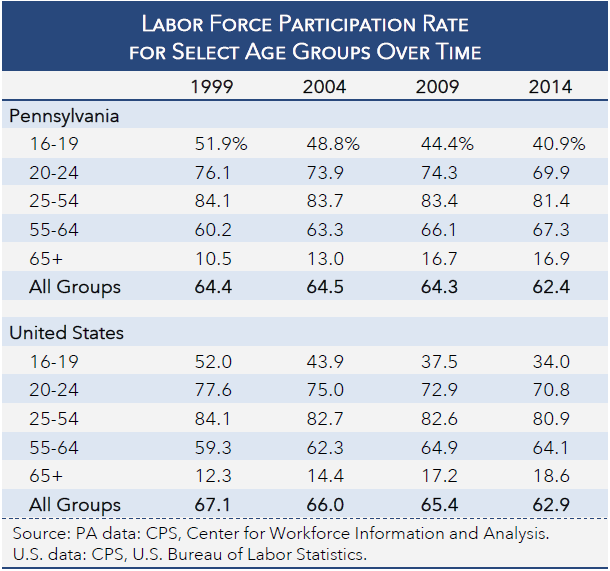
Since 1999, Pennsylvania LFPRs have fallen for teens and young adults. For the 16-19 years old age group, the LFPR fell 11 percentage points (pp) from 1999 (51.9%) to 2014 (40.9%) for Pennsylvania and 18 pp (52.0% in 1999, 34.0% in 2014) for the U.S. (See table below.) Over that same time period, the 20-24 years old age group saw a decline in LFPRs of 6.2 pp (76.1% in 1999, 69.9% in 2014) for Pennsylvania and 6.8 pp (77.6% in 1999, 70.8% in 2014) for the U.S. While the factors behind these trends remain unclear, it is likely that higher college attendance negatively impacts the LFPR of these age groups.
While the middle-aged working population also saw LFPRs decline over the same 15-year period, the magnitude of the decline was less pronounced. For the 25-54 years old age group, the LFPR fell 2.7 pp from 1999 (84.1%) to 2014 (81.4%) for Pennsylvania and 3.2 pp (84.1% in 1999, 80.9% in 2014) for the U.S.
Unlike the young to middle-aged population, the older adult population’s LFPRs have increased significantly. The LFPR for the 55-64 years old age group increased 7.1 pp from 1999 (60.2%) to 2014 (67.3%) for Pennsylvania and 4.8 pp (59.3% in 1999, 64.1% in 2014) for the U.S. The LFPRs have also increased for those in the 65 years and older age group by a similar amount (6.4 pp for Pennsylvania, 6.3 pp for U.S.). It is unclear if these higher LFPRs reflect a need or desire to work longer. Regardless of the reason, the data show that these trends were established long before the last recession.