March 2016
April 01, 2016 | Revenue & Economic Update
On March 24th, the U.S. Bureau of Economic Analysis (BEA) released state Personal Income data for 2015 Q4.Personal Income is a broad measure that includes all types of income such as wages, business profits, Social Security, pensions, dividends, rent, interest and various disability and income security benefits. For 2015, Pennsylvania Personal Income increased by 3.3%, versus 4.4% for the U.S.
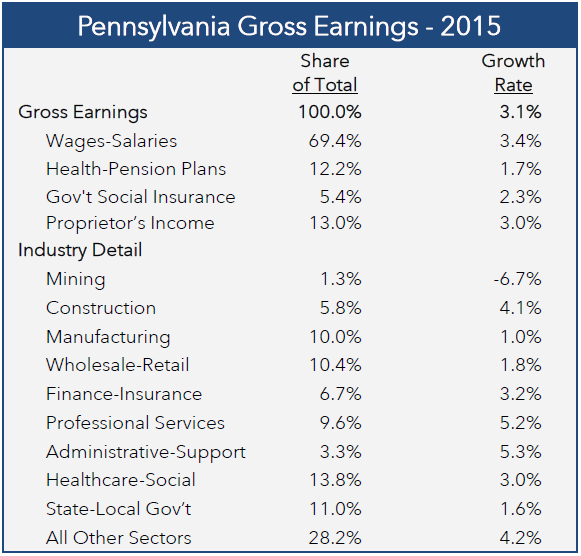
The main component of Personal Income is gross earnings by place of work, which includes wages-salaries, employer contributions to health insurance and pension plans, employer contributions to government social insurance (i.e., Social Security and disability) and proprietor’s income (sole proprietors, partnerships and independent contractors). The table shows the composition for each component and the preliminary growth rate for 2015. For proprietor’s income, the data will likely be revised upwards later this year due to technical factors.
The BEA also publishes industry tabulations of gross earnings, and those data can be used to quantify the relative size of a given sector for the Pennsylvania economy. For 2015, the only sector to contract was the mining sector (-6.7%), largely due to a reduction in employment from a decline in natural gas drilling activity. Healthcare-social services was the largest sector (13.8% of total), and gross earnings increased by 3.0%. The next three largest sectors recorded modest gains in gross earnings: state and local government (11.0% of total gross earnings, 1.6% growth), wholesale-retail (10.4%, 1.8% growth) and manufacturing (10.0%, 1.0% growth). Some mid-sized sectors recorded stronger earnings gains (e.g., construction and professional services) due to above-average employment expansions.
For General Fund revenues, the wages-salaries component of gross earnings is a crucial series since it motivates personal income tax collections and, to a large extent, sales and use tax remittances. The preliminary data from the BEA show a weakening trend during the calendar year: Q1 (3.6% year-over-year growth), Q2 (3.5%), Q3 (3.5%) and Q4 (3.0%). At this point, it is unclear whether the Q4 weakness portends a lower growth path, or represents an unusual data point due to weak year-end bonuses or seasonal hiring.